
Signal system for managing eyeglass activity features multi-interface, very easy main interface as well as easy input screens to handle a insurance additions
Signal support multiple languages
Our support team is always there to help our customer via phone or email
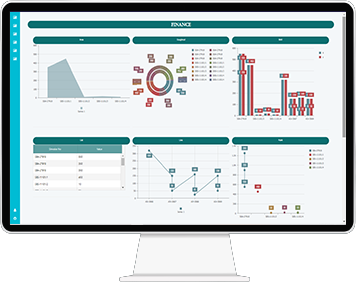
Signal can converting a set of data that is difficult to read into more clear and easier to read graphics, thus making decisions easier and knowing what is happening faster and easier
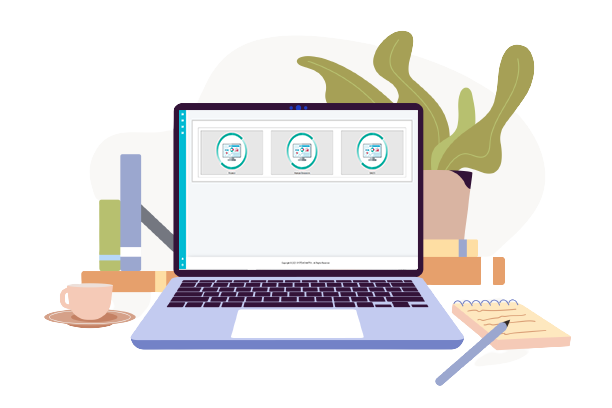
The system manager can create effective dashboards by identifying the name of the page and the number of indicators that will appear on the page
Signal enables you to link several database
Collaborate on creating dashboards for the main dashboard and make informed decisions with team members and within dashboard boards on various online platforms for collective use
With the graphical dashboard, you can see a holistic view of his company's performance, allowing you to do what it takes to address and fix problem
Access dashboard through personal computers, laptops, tablets and mobile phones
The system manager can create effective dashboards by identifying the name of the page and the number of indicators that will appear on the page, as well as linking it to the sources of data you feed, as well as assigning the necessary powers to authorized users to view it
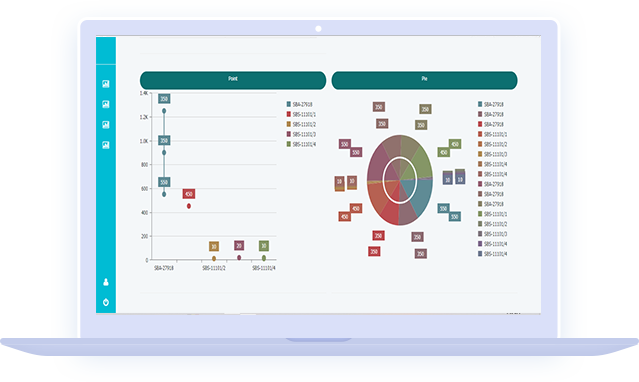
The program allows you to choose the database that has been added to each series and write the name of the series in a situation where the drawing contains more than one series
Each control panel is independently assigned, giving the ability to create several dashboards and each dashboard that is intended for a dedicated user
The program allows you to draw several formats such as: sum of aggregate data, table, graph in several forms such as: bar, circle, donut, line, points or area
And it provides more features that you will discover when you use it
Imam Muhammad bin Saud Road - the intersection of Abu Bakr Al-Siddiq Road, Office No.10
Send us your query anytime!